Data visualization is a way of representing data visually, often with the aim of making complex data easier to understand. This is beneficial for large companies who have a lot of facts, data and statistics but need to able to use their information to their advantage. It’s also beneficial to small business owners who need to be able see a clear path for growth opportunities. At the end of this article, we have a checklist that will help you determine if our services are right for you.
What is a data visualization?
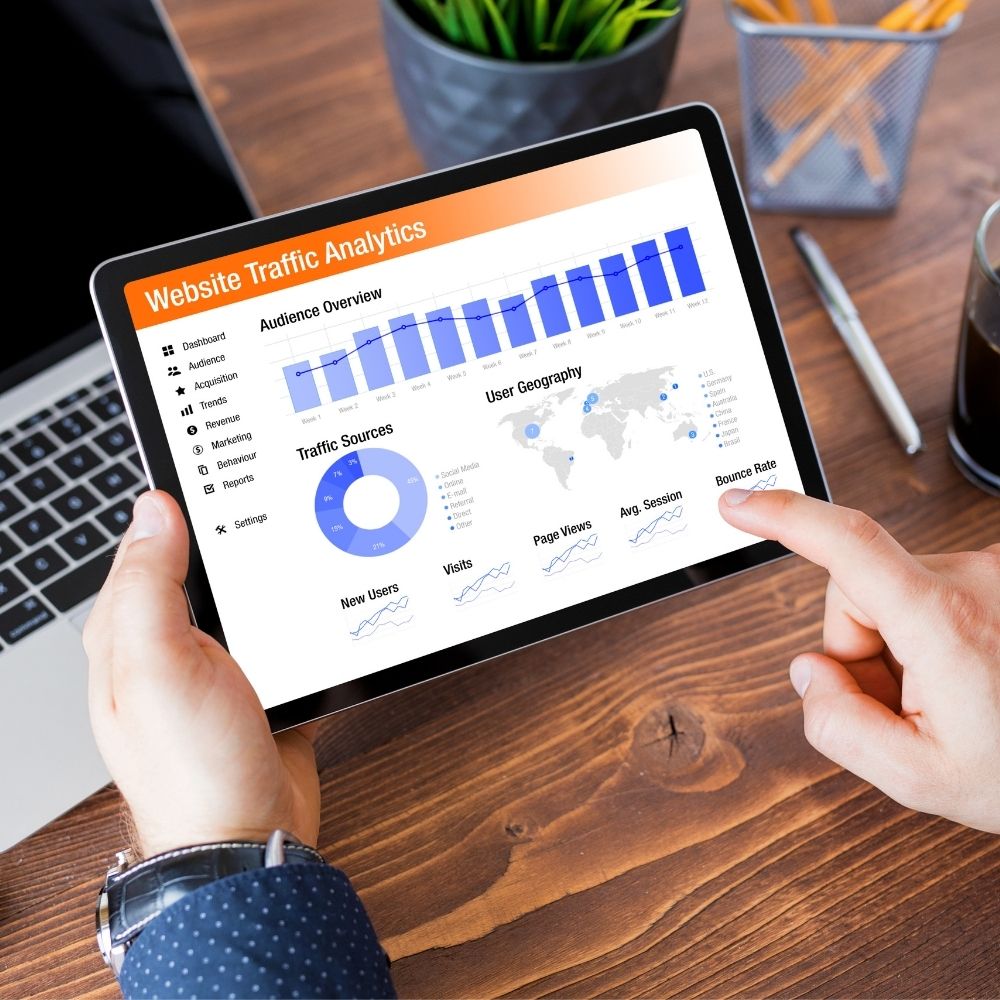
Data visualization is the process of presenting information in a visual way that helps people understand it better. The human brain can easily understand patterns and relationships in an image much more quickly than it can from looking at text, numbers, or charts. It’s often used for large amounts of complex data because it enables you to see patterns and trends that might be difficult to see when viewing the same dataset as text or spreadsheets.
The process of creating data visualizations typically involves four steps: collecting data from sources such as databases or social media; transforming the raw data into meaningful information through statistical analysis; translating this information into an understandable form (i.e., a chart) for presentation or storage; and making sure that these graphics are clear and easy to understand for viewers.
Data visualization for large companies and corporations.
Data visualization helps large companies by making the information they have more accessible and understandable. It also helps them identify trends and risks in their business, figure out where to increase their budget, and approach new markets.
Data visualization is a powerful tool to help large companies make sense of their data. It helps them identify patterns and trends that they might not have noticed otherwise.
Data visualization for small businesses.
Data visualization is also helpful for small businesses and startups who don’t have the resources to pay for expensive software packages like Adobe Illustrator or Photoshop. Being able to plainly see your data and learn how you can collect more and better data in order to grow your business is part of the growing process. When you’re a small business is ready to look at how you can best move forward for optimum growth, consider hiring a data visualization expert.
Do I need a data visualization for my business or company?
Data visualization can be an excellent resource for any company, regardless of size or industry.
We have the experience and knowledge to get your company through any season your comaony is in. We are able to help you use your data for good and find ways to make it work for you.
Use the following checklist to find out if it’s time to call us today.
__ Your company or business is about to merge with another company.
__ You are entering an uncertain time for your business and need help navigating the waters.
__ Your company has collected data but is unsure how to use it.
__ Your excel spreadsheets are out of control.
__ You feel lost when it comes to certain aspects of your business and aren’t entirely sure what some of the numbers and data you have represent.